Technology for complex waters

Produced water, no longer a liability.

Electrochemical treatment for oily oil-and-gas waters: the phenomenon, explained in five steps. We show how the reactor works, which destination routes exist, and what the tests need to show before any deployment.

  • Electrocoagulation · electro-oxidation · electroflotation
  • Skid modules of 10 m³/h nominal
  • Service model: the unit is ours
  • Route defined test by test
Scroll to see the process

The problem

Produced water is not dirty water. It is an emulsion.

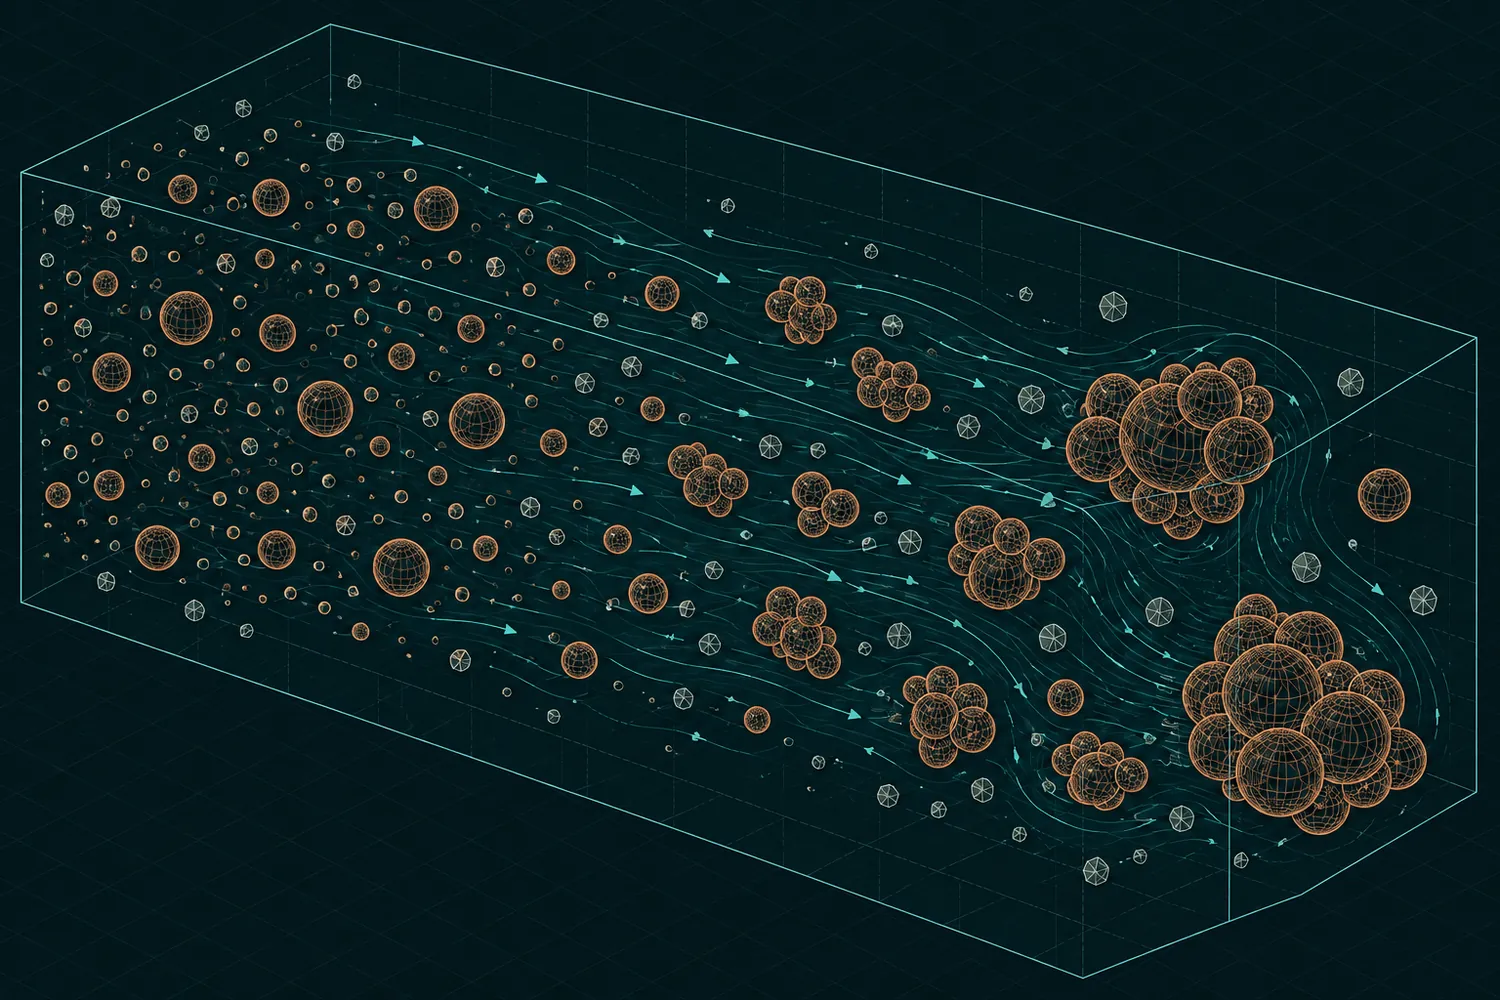
Technical line illustration: fine oil droplets dispersed in water, aggregating into larger flocs along the flow.
Conceptual illustration — oil-in-water emulsion at microscopic scale: fine, stable droplets that only separate once destabilized.
  1. What produced water is

    It is the water that arrives with the oil, drawn from the reservoir in the same stream as the crude. It comes emulsified — fine oil droplets dispersed in water — with salt, solids and dissolved organics. Composition varies with the reservoir and with the operation: there is no single produced water.

  2. Why it is hard

    The emulsion is stable by construction: fine droplets, natural surfactants and fine solids stabilize it. The load varies from well to well and from day to day, and chemistry in motion defeats fixed dosing and off-the-shelf solutions. Treating this stream demands a process that adjusts to the matrix — not the other way around.

  3. Why pumping and removal alone fall short

    Without breaking the emulsion, oil and solids stay locked in the water — into the tank, onto the truck, to the final destination. The liability does not disappear: it moves and returns as operating cost. That is why treatment starts with phase separation, not with transport.

The technology

The reactor makes the treatment inside the stream.

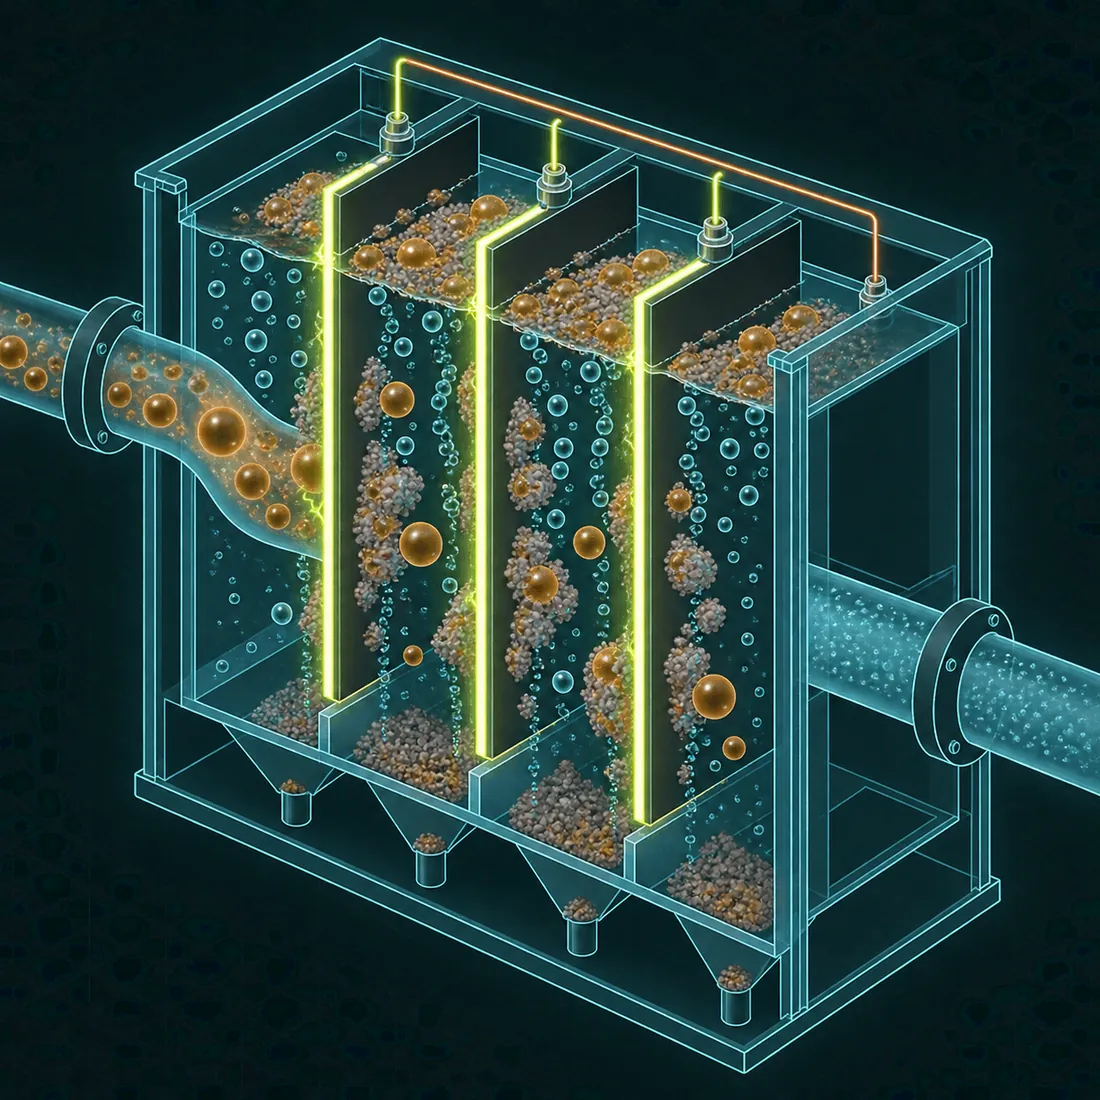
In the electrochemical reactor, a controlled electric current generates the treatment agents in situ: coagulant — metal ions released by the electrode — and oxidants — hydroxyl radicals (•OH). Electrolysis uses variable-frequency alternating current, tuned to the load of the stream. Nothing is dosed from outside: the phenomenon is born in the stream itself, and operating parameters are defined test by test.

Cutaway illustration of an electrochemical reactor: energized electrode plates, rising microbubbles and forming flocs of oil and solids.
Conceptual cutaway of an electrochemical reactor — it does not depict a specific piece of equipment.

Electrocoagulation

Metal ions released by the electrode destabilize the emulsion: they neutralize charges and aggregate oil droplets and particles into flocs. Coagulation happens inside the stream itself, with no external dosing of salts. It is the first step that lets the phases separate.

Electro-oxidation

Hydroxyl radicals (•OH) oxidize dispersed organics and reduced compounds, such as sulfides. Oxidation opens the way for separation and lowers the load that reaches polishing. The oxidizing power is born at the electrode — not in a dosing tank.

Electroflotation

Microbubbles formed during electrolysis attach to the flocs and carry oil and solids up to the surface. Flotation organizes the phases into layers within the reactor itself. Less turbulence, cleaner separation.

Separation and polishing

Oil, water and sludge organize into distinct phases; the treated water moves on to filtration and final adjustments. Polishing is sized for the chosen destination — discharge, reinjection or reuse. Each destination has its own criteria, and the criteria define the finishing.

Real routes combine the reactor with process auxiliaries — polymers, pH adjustment, peroxide, filtration or flotation — defined test by test. We do not deliver a "single process": we assemble the route your matrix demands.

Validation through bench and pilot treatability tests, with analyses at an accredited laboratory. What the tests show for your stream defines the route — not the other way around.

Infographic

The phenomenon in five steps.

One skid-mounted unit, five steps. Follow the stream from inlet to destination — and, through the lens, what happens at droplet scale.

At droplet scaleConceptual microscopic view

01/ 05

Stream inlet

The stream arrives with a variable load: oily emulsion, salt and fine solids.

At droplet scale:Fine oil droplets and fine solids dispersed in water, stabilized by surface charges and natural surfactants.

Conceptual scheme. Routes and outcomes depend on effluent characterization and treatability tests — they do not constitute a performance guarantee.

Comparison

Complete line against complete line.

From secondary treatment onward, the meaningful comparison is not between isolated unit operations but between complete treatment lines, sized for the same output quality.

One route covers four stages of conventional treatment

Conventional routes chain three to five distinct units to reach compliance. From stage 2 onward, the electrochemical module compresses that chain.

Preliminary and primarySecondaryTertiary and disinfectionReuse and recovery
  • Physical conditioningScreens, oil separation, equalization — Stage 1
  • Conventional physicochemicalCoagulation, flocculation, precipitation — Stages 1–2
  • Anaerobic biologicalUASB, anaerobic digesters — Stage 2
  • Aerobic biologicalActivated sludge, MBBR, SBR, nitrification — Stage 2
  • Conventional tertiaryAOX polishing, membranes, activated carbon, chlorination — Stage 3
  • Electrochemical moduleSecondary, tertiary, disinfection, reuse and recovery — Stages 2–4

Reading: the only stage that remains upstream is physical conditioning, present in any industrial plant. From stage 2 to 4, the electrochemical module replaces — subject to the characterization of each stream — the biological reactor, chemical nutrient precipitation and disinfection. The correct economic comparison is between complete trains sized for the same output quality.

Nineteen criteria, six routes

The ranges for conventional routes derive from reference technical literature and published multi-plant surveys; those for the electrochemical module derive from the campaigns described in this section.

Axis A — Process profile: what the route actually delivers
CriterionPhysical conditioningConventional physicochemicalAnaerobic biological (UASB)Aerobic biological (activated sludge, MBBR, SBR)Conventional tertiaryElectrochemical module
Operating principleGravity separation: screening and flotation, with no chemical change to the matrix.Colloid destabilization by purchased reagents, followed by precipitation.Organic matter digestion by an anaerobic consortium, with biogas generation.Biological oxidation under forced aeration, in suspended or attached biomass.Oxidation by ozone, UV or peroxide; membrane rejection; adsorption on carbon.Double conversion under variable-frequency alternating current: coagulant and oxidant generated in situ, with hydroxyl radical production.
Treatment stages coveredPreliminary and primary.Primary; polishing.Secondary.Secondary; nitrification.Tertiary; disinfection.Secondary, tertiary, disinfection, reuse and recovery — in a single module.
Removed parametersCoarse and settleable solids; free oil and grease.TSS, colloidal fraction, phosphorus, metals, color.BOD; partial COD; solids.BOD, COD, ammonia N, TSS.Micropollutants, color, pathogens.COD, BOD, total N and P, surfactants, sulfides, TOG, TSS, color, metals.
Detention timelower is betterMinutes; 1 to 2 h with a primary clarifier.20–60 min, across mixing, flocculation and separation.6–10 h, plus a secondary clarifier.6–24 h, plus a secondary clarifier.15–60 min, on already treated effluent.Under 5 min in complex effluent — two orders of magnitude below the biological routes.
Organic load removal efficiencyhigher is betterBOD 5–10%; 25–40% with a primary clarifier. Does not reach the dissolved fraction.COD 30–70%; BOD 50–80% and TSS 80–90% with continuous dosing.BOD 60–75%, COD 55–70% — the legal minimum, with no extra margin.BOD 85–95%, COD 85–90% — the industry reference.COD 40–70%, on the residual upstream load.COD 87.8–99.7% (94.4% average on raw sewage); BOD 99.0–99.6% on the described matrices.
Nutrient removal (N and P)higher is betterNone.Phosphorus 80–95% by precipitation; nitrogen 20–25%.Practically none; converts organic N into ammonia.25–30% without a dedicated stage; effective removal requires nitrification, denitrification and chemical dosing.Partial, depending on the process adopted.N 34.7 → < 1.1 mg/L and P 6.5 → < 1 mg/L in the campaigns, with no precipitating reagent and no dedicated stage.
Admissible matrix envelopehigher is betterIndifferent to composition.Broad, subject to redosing.Narrow: pH 6.5–7.5; sulfides and metals are inhibitors.Narrow: C:N:P ratio, salinity and toxicity are limiting.Requires a stable upstream load.Declared envelope for produced water: salinity up to 50,000 mg NaCl/L, pH 3 to 10, H₂S up to 4,000 ppmv, TOG up to 1,000 mg/L; high conductivity is functional to the process.
Axis B — Asset economics: energy, inputs, sludge, footprint and coproducts
CriterionPhysical conditioningConventional physicochemicalAnaerobic biological (UASB)Aerobic biological (activated sludge, MBBR, SBR)Conventional tertiaryElectrochemical module
Energy consumption (kWh/m³)lower is better0.02–0.10 — lifting only.0.05–0.30 — mixing, flocculation and flotation.0.02–0.10 — pumping only.0.30–0.80 at medium and large scale; aeration accounts for 25 to 80% of plant consumption.0.05–2.50 additional: filtration and carbon, reverse osmosis, intensive AOP.0.25–0.50, depending on effluent type — replaces aeration and tertiary consumption; admits dedicated photovoltaic supply.
Purchased chemical additiveslower is betterNone; no input exposure.Continuous: coagulant, polymer, alkali and oxidant.Occasional: alkali for pH and alkalinity control.Occasional: nutrients, antifoam and carbon source.Continuous: ozone or peroxide, antiscalant, chlorine, media replacement.Coagulant and oxidant generated in situ; process auxiliaries, when required, defined test by test.
Solid waste: volume, class and destinationlower is betterCoarse solids, grit and scum — landfill.Precipitation increases sludge mass; Class I in the presence of metals.0.10–0.20 kg TSS/kg COD, already digested and thickened.0.6–0.9 kg TS/kg BOD to dispose of (1.2–1.6 to treat); mandatory dewatering and landfill.Liquid concentrate and spent carbon bed.Class II B inert solid, suitable for incorporation into ceramics and concrete; in sewage, NPK substrate.
Footprintlower is betterVery low.Compact, especially with flotation.0.03–0.10 m²/inhab in an arrangement with compact post-treatment.0.2–0.3 m²/inhab for activated sludge; stabilization ponds, 1.5 to 5.0 m²/inhab.Compact, added to the upstream treatment line.Compact and stackable; civil works limited to an impermeabilized floor and containment.
Marketable coproductshigher is betterNone.None.Biogas, for cogeneration or flaring.None.None.Recovery routes assessed case by case: reuse water, inert solid, NPK substrate and further lines under development.
Axis C — Operation, risk and continuity
CriterionPhysical conditioningConventional physicochemicalAnaerobic biological (UASB)Aerobic biological (activated sludge, MBBR, SBR)Conventional tertiaryElectrochemical module
Start-up and response timelower is betterImmediate.Minutes — real-time dosing adjustment.15–60 days with inoculum; 3 to 6 months without.15–30 days — sludge formation and stabilization.Hours.Minutes — electrical response, with no biological maturation; follows the flow curve on and off.
Tolerance to load shock and toxicityhigher is betterIndifferent to composition.High, subject to redosing.Critical: sulfides, metals and pH drops inhibit methanogenesis; recovery takes weeks.Low: risk of biomass washout and 2 to 4 weeks of restabilization.Medium: requires a stable upstream load.Demonstrated on an extreme matrix in the campaigns: inlet COD of 103,000 mg/L with 300 mg/L of sulfide brought to compliance.
Operational continuityhigher is betterHigh.Depends on uninterrupted reagent supply.Reactor imbalance means weeks of recovery.Biomass loss means restabilization.Downtime for media replacement and membrane cleaning.30% excess capacity per reactor; one module can be serviced without interrupting treatment.
Greenhouse gas emissionslower is betterNegligible.Indirect — reagent and sludge production and transport.Fugitive methane: about 3.9 kg CO₂e/m³ without biogas capture.Nitrous oxide from nitrification and denitrification: about 0.3 kg CO₂e/m³.Indirect — energy and oxidant inputs.No process CH₄ or N₂O; Scope 2 follows the electricity mix (about 0.015 kg CO₂e/m³ on the Brazilian grid) and is cancelled out with dedicated photovoltaic generation.
Compliance with CONAMA 430/2011higher is betterDoes not comply — pre-conditioning stage.Partial: pH, oil and grease, settleable solids, metals and phosphorus; BOD depends on dosing.Partial: minimum 60% BOD removal with a narrow margin; requires post-treatment.Exceeds the 120 mg/L BOD cap of art. 21.Exceeds it, as a complement to a compliant secondary stage.Compliance demonstrated in the campaigns, against the more restrictive of CONAMA 430/2011 and state guideline — subject to the characterization of each stream.
Suitability for reuse and recoveryhigher is betterNone.Low: raises the salinity of the treated effluent.Low: requires mandatory post-treatment.Medium, with complementary filtration and disinfection.Full, at the cost of a complete upstream treatment line.Reuse or potable water, per local legislative parameters, under the campaign conditions; recovery routes assessed case by case.
Maturity and scalabilityhigher is betterUniversal.Thousands of references in the country.National standard in sanitation; scales by civil construction.National standard in sanitation; scales by civil construction.Established in the market.Reference industrial unit of 100 m³/h; campaigns across multiple matrices; scales by adding cartridges, from 1 to 1,000 m³/h.

Filled bars indicate relative magnitude on a five-level scale (0 = none); the marker beside each criterion shows the favorable direction. Electrochemical module values refer to the campaigns described — performance on each stream depends on characterization and testing.

Three architectures, the same output quality

Comparing an integrated module with isolated unit operations is asymmetric. The table sums every unit needed to reach each target quality, for domestic sanitary sewage.

Complete lines compared for the same output quality, in domestic sanitary sewage
Basis of comparisonConventional system AAnaerobic + aerobic post-treatment + disinfectionConventional system BSystem A + tertiary treatment for reuseCWS electrochemical linePhysical conditioning + electrochemical module
Process units5 to 77 to 92 to 3
Total detention time8 to 30 h9 to 32 hUnder 1 h
Start-up time15 to 60 days with inoculum; 3 to 6 months without15 to 60 days with inoculum; 3 to 6 months withoutMinutes — immediate start, with no biological maturation
Purchased chemical additivesAlkali, chlorine, polymerSystem A + oxidant, antiscalant, adsorbent mediaNone purchased: coagulant and oxidant generated in situ; process auxiliaries defined test by test
Whole-plant footprint0.03–0.30 m²/inhab0.05–0.35 m²/inhabCompact and stackable
Sludge to dispose of20–45 gTS/inhab·d20–45 gTS/inhab·dInert solid, suitable for incorporation into ceramics and concrete
Process climate liabilityFugitive CH₄ and N₂OCH₄, N₂O and tertiary energyNo process CH₄ or N₂O; Scope 2 follows the electricity mix
Recovered coproductsBiogasBiogasReuse water, inert solid and NPK substrate; further recovery routes assessed case by case

Orders of magnitude at 160 L/inhab·d and 50 gBOD/inhab·d. It ranks alternatives; it does not size them.

Where the difference is decisive

  • Toxic, saline or extreme-load matrices — when biological reactor start-up is unviable and the conventional alternative becomes incineration or co-processing, orders of magnitude more expensive.
  • Recovery of dissipated assets — metals in mining and metallurgy streams, oil and grease, nutrients — load that conventional treatment converts into sludge and sends to landfill.
  • Severe footprint constraints — retrofits in confined sites, port units or platforms: a compact, stackable plant that uses the existing structure.
  • Intermittent, seasonal or emergency operation — with no biomass to keep active between campaigns, the fixed cost of idleness disappears.
  • Reuse targets based on AOP, membranes or reverse osmosis — among the most input- and energy-intensive routes for reaching the same parameters.
  • Scope 1 decarbonization — where the methane and nitrous oxide liability of biological treatment is material to the inventory.

Sources

Ranges for conventional routes (1 to 5): von Sperling (activated sludge; stabilization ponds; introduction to water quality and sewage treatment), Chernicharo (anaerobic reactors) and Alem Sobrinho & Jordão (PROSAB — post-treatment of anaerobic reactor effluents). Peer-reviewed multi-plant surveys: a census of 241 Italian plants (Water Science & Technology 77/9, 2018), a measurement campaign across 14 Portuguese plants (Water 14, 2022) and the EPRI / Water Research Foundation benchmarking (2013). Reviews of advanced primary treatment and tertiary and reuse processes (Journal of Water Process Engineering, 2017; US EPA, 2017; Water Research X 13, 2021).

Emission factors and inventory: IPCC (2021), AR6, Working Group I, ch. 7 — global warming potentials of 27.0 (methane) and 273 (nitrous oxide) over 100 years; IPCC (2019), Refinement to the 2006 Guidelines, vol. 5, ch. 6; Brazilian electricity generation emission factor per MCTI, National Emissions Registration System, SIN operating margin. Conversion premises: 160 L/inhab·d and loads of 50 gBOD/inhab·d and 100 gCOD/inhab·d.

Electrochemical module values refer to the campaigns described in this section. Performance in each application depends on characterizing the specific stream and on prior treatability testing.

Routes

Where the treated water goes.

Compliant discharge

Water treated until it meets the discharge criteria that apply to your operation and your permit. The required parameters define the degree of polishing in the route. Compliance is verified by test, with analyses at an accredited laboratory — not by inference.

Condition: Conditioned on the matrix and on the permit.

Reinjection

Returning treated water to the reservoir is the destination that reduces the volume withdrawn from the field. Before injection, the stream must remain stable and compatible with the formation. That is why the assessment starts with the chemistry of the water and the well — not with the equipment.

Condition: Conditioned on chemical compatibility with the well.

Industrial reuse

Polished water going back into the process — utilities, washing, cooling or another internal operation. The reuse goal defines the quality parameters and, with them, the polishing required. Each use has its own criterion; the treatment is adjusted to it.

Condition: Requires polishing to match the goal.

Route under development

Recovered oil

Emulsion breaking → flotation → centrifugation: a route to separate the retained oil and return it to the producer. The route remains under development and evaluation, separate from the water stream.

Proposal under evaluation, separate from the water stream.

Cases

What we measured, sample by sample.

Four tests and pilots, four distinct matrices — offshore, tannery, port terminal and sanitation. Each number holds for that sample, under the route indicated. Repeating the result requires repeating the conditions; that is why we always start with characterization.

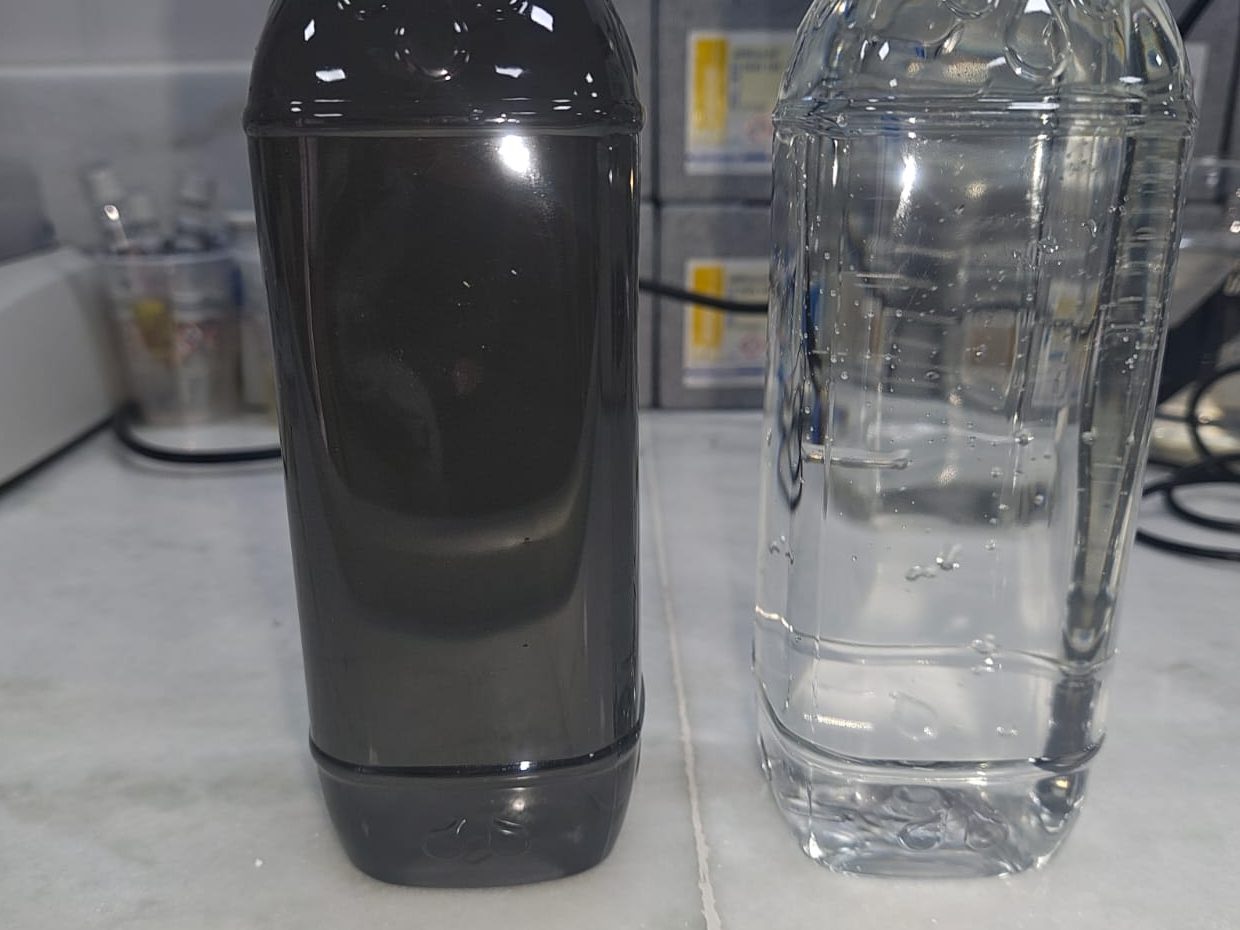
Two bottles side by side: dark effluent and clarified stream.
Oil and gas — offshore

Offshore produced water

Bench treatability test (2025) on produced water from an FPSO-type asset.

Three electrochemical routes compared; results from the intensified-oxidant route — reactor + auxiliaries + filtration.

Offshore produced water samples went through three electrochemical routes compared at bench scale. The intensified-oxidant route — reactor, auxiliaries and filtration — showed the best combination of dispersed-oil and organic-load removal, with energy also measured in field operation. The result supports the next step: a larger-scale test.

TOG
204 → < 5 mg/L (97.5% removal)
COD
4,399 → 301 mg/L (93.2%)
H₂S
7.25 → 0.04 mg/L (> 99%)
Field energy
0.25–0.67 kWh/m³

Result from that sample, on the tested route; treated TOG below the CONAMA 393/2007 reference limit (29 mg/L).

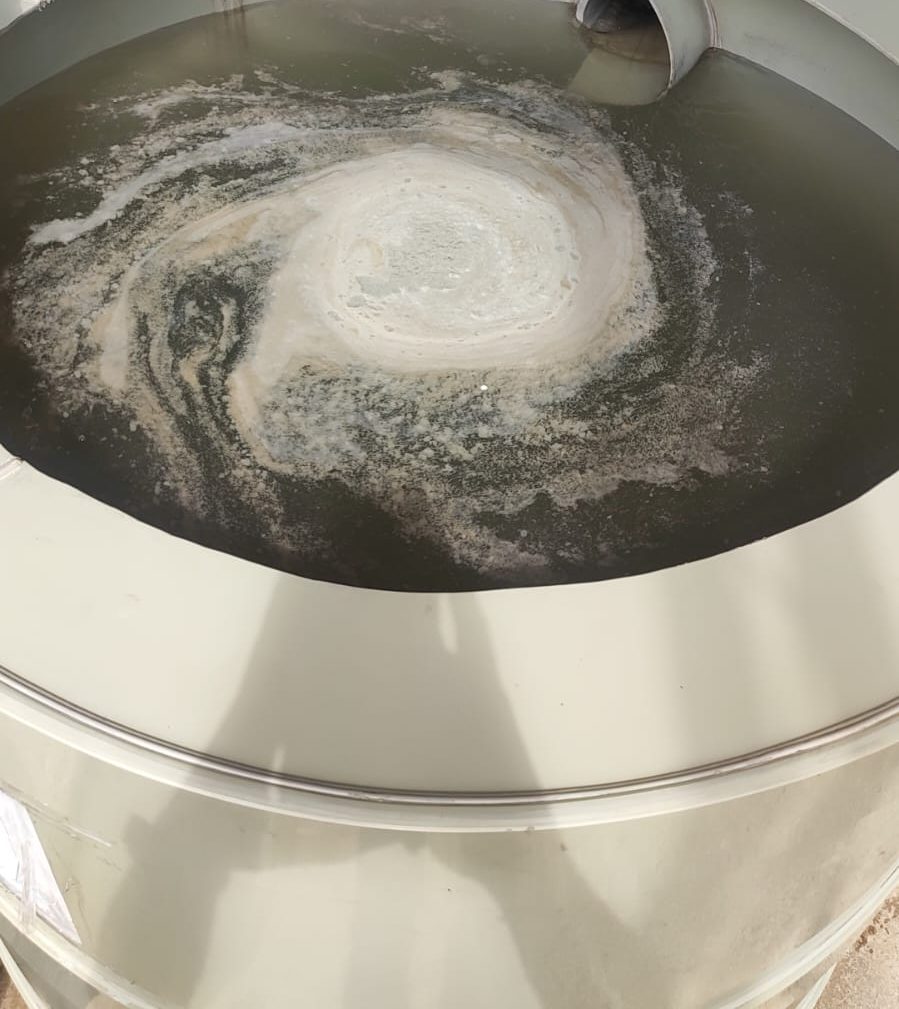
Process tank with separating liquid.
Tannery

Tannery effluent

Raw effluent after disc filter (bench, no pH adjustment) and post-ETP effluent in continuous flow (2026).

Reactor + auxiliaries — polymers; pH 5.0 with acid in the continuous run — + filtration/flotation.

Tannery effluent means high, variable organic load. We tested two distinct streams — raw after disc filter and post-ETP effluent — at bench and in continuous flow, adjusting polymers and pH test by test. The route confirmed substantial COD and turbidity removal in those streams, with filtration and flotation completing the finishing.

COD (raw)
3,800 → 200 mg/L (94.7%)
Turbidity
> 500 → 1 NTU (> 99.8%)
COD (post-ETP)
580 → 21 mg/L (96.4%)
Ammoniacal N
60 → < 4 mg/L (> 93%)

Two distinct sampling points (raw and post-ETP); values valid for those streams and routes.

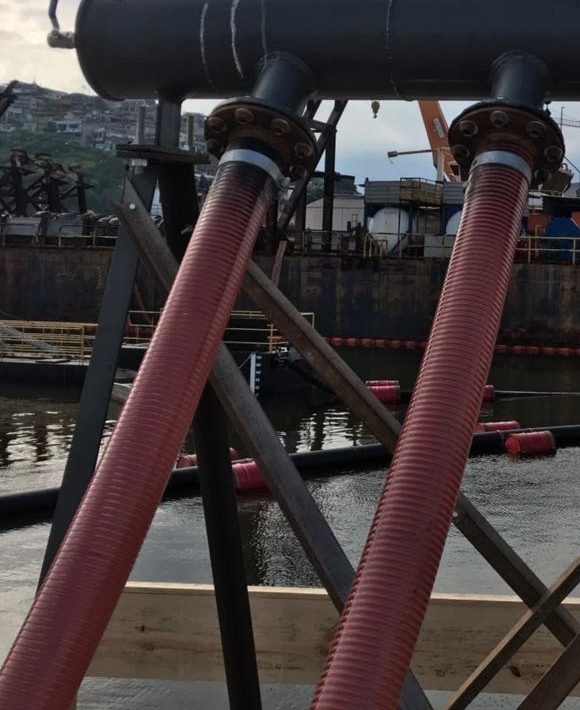
Loading hoses on a port quay.
Port terminal

Blend of port streams

Blend of five port streams — seawater, well water, drainage; primary step at bench scale (2026).

Reactor + anionic polymer + filtration.

Port streams combine different origins in the same terminal: seawater, well water and drainage. We tested the blend as a primary step, with reactor, anionic polymer and filtration. The step demonstrated removal of organic matter and solids, and pointed to what was missing: additional nitrogen polishing before any discharge.

BOD
375.8 → 28.7 mg/L (92.4%)
COD
788.5 → 57.9 mg/L (92.7%)
TSS
380 → 31 mg/L (91.8%)
Hardness
1,744 → 258 mg/L

Primary step only: nitrogen still non-compliant; additional polishing required for discharge.

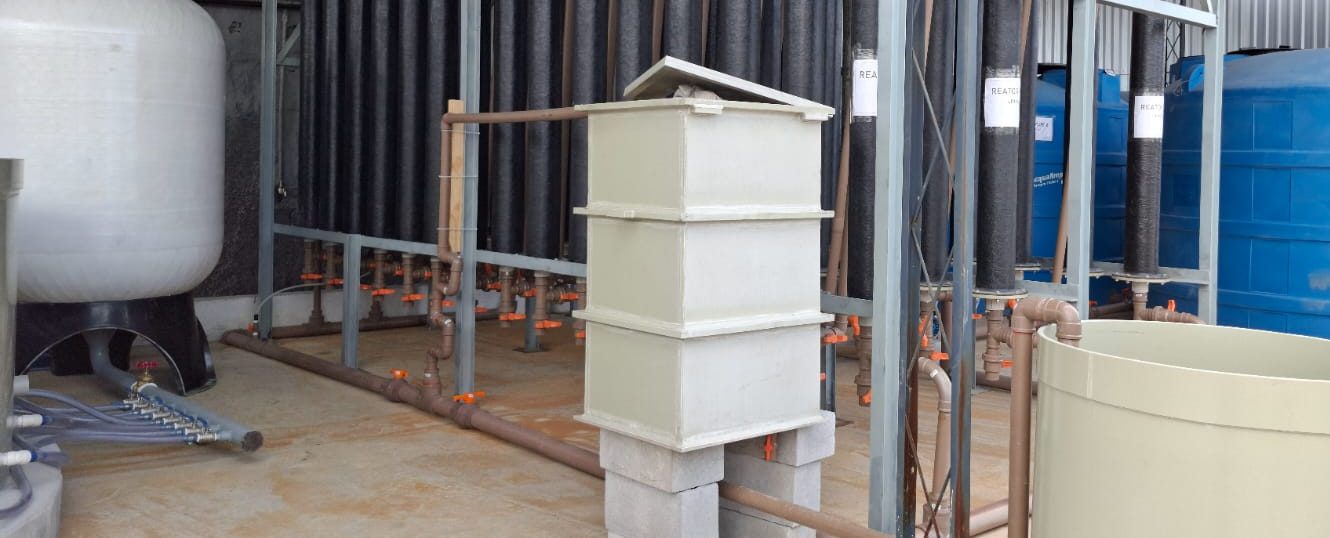
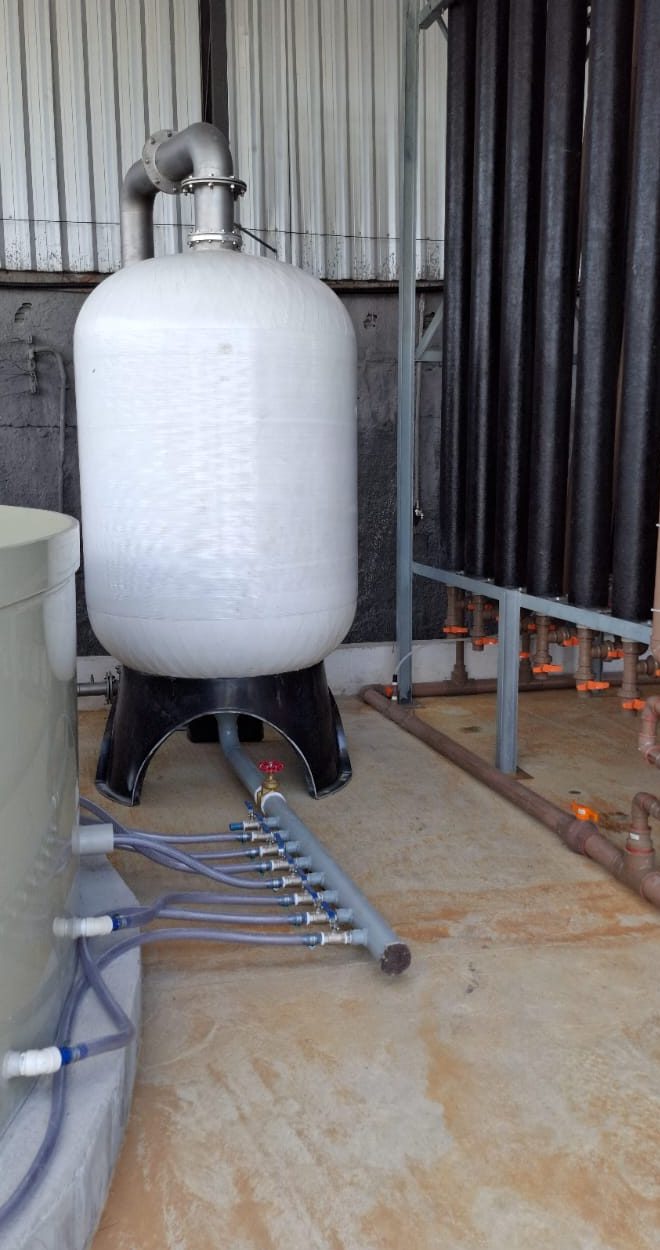
Skid-mounted unit with tank and filtration columns.
Sanitation

Continuous pilot at a municipal WWTP

Municipal WWTP; 1 m³/h continuous pilot with integrated unit operations (2026).

Integrated pilot in continuous operation.

A continuous 1 m³/h pilot ran integrated into a municipal WWTP, with the unit operations of the future skid unit. The goal of the pilot was not to set records: it was to demonstrate operational stability under real plant conditions. Accredited-laboratory analytical validation is in progress.

Pilot scale
1 m³/h (continuous)

Qualitative performance; accredited-laboratory validation in progress.

> 90%electrolytic yield of the reactor
0.25–0.45 kWh/m³per 1,000 mg/L of removed COD (bench)
6 minreactor time in bench tests
10 m³/hper skid module (nominal)

Ranges measured in tests and nominal equipment capacities; actual sizing depends on effluent characterization.

Results from bench and pilot treatability tests, with analyses at an accredited laboratory; values measured on those samples, under the routes indicated — they do not constitute a performance guarantee.

Model

Service, not equipment.

You contract the treatment of the stream — not an asset on your site. The unit is ours: it comes in as a service, sized and operated for your matrix.

  • No equipment purchase by the client: the unit is ours and stays ours. What is contracted is a treated stream, not an asset.
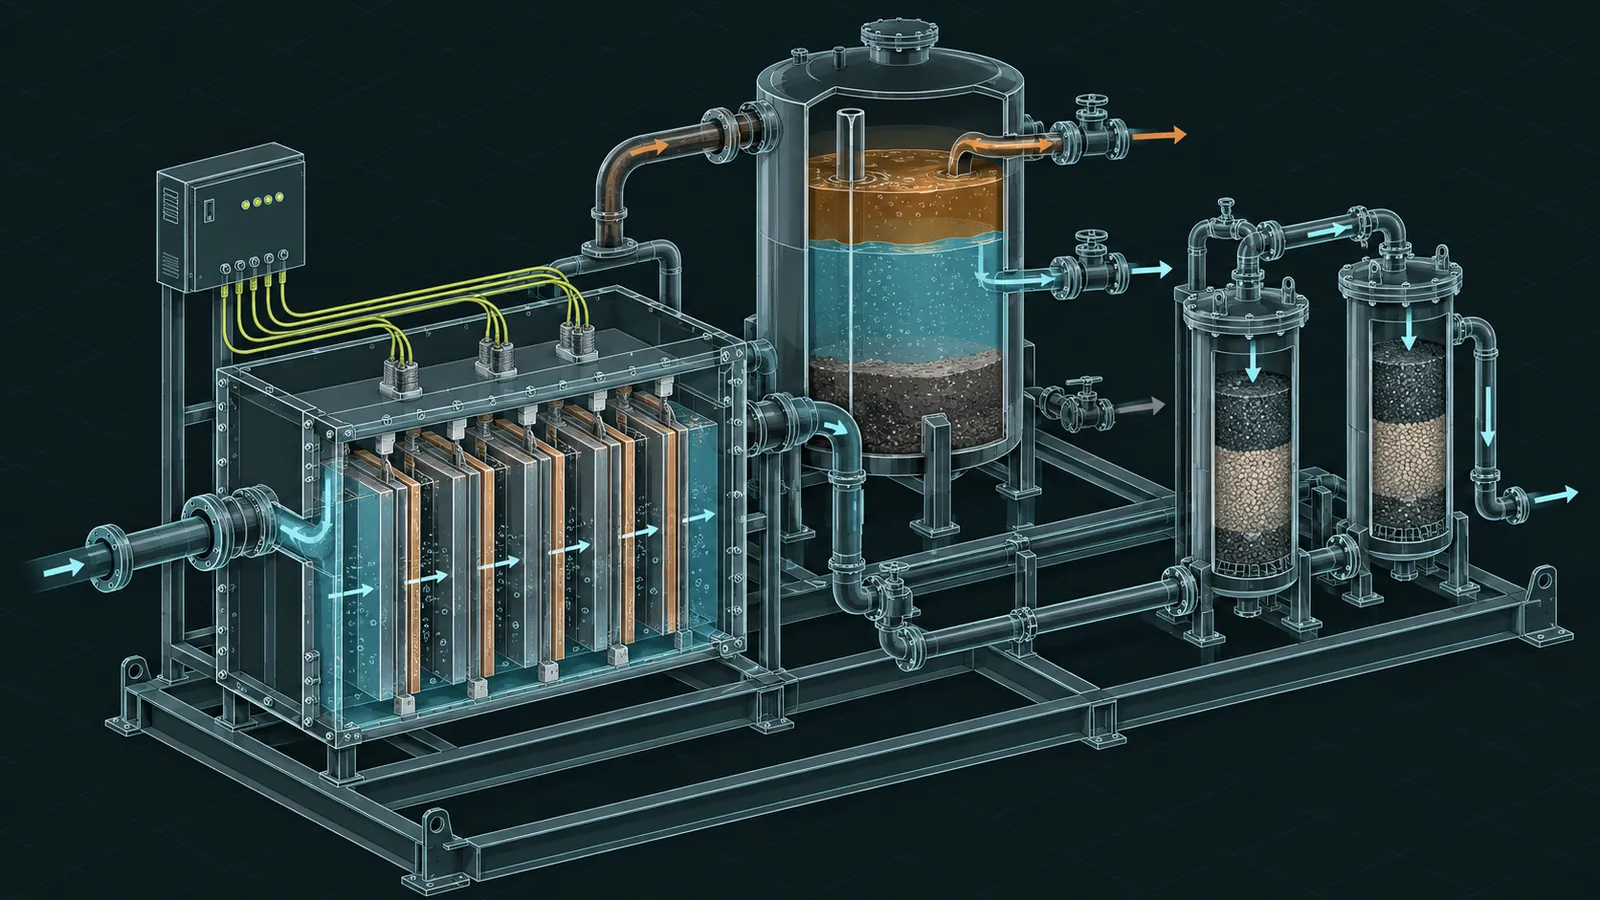
  • Modular skid-mounted unit, sized from effluent characterization and treatability tests. Nominal 10 m³/h modules add up as volume grows.
  • Remote operation, automation and telemetry: parameters monitored from a distance, with continuous performance logging.
  • Performance agreed from effluent characterization — and verified test by test, not promised from a catalog.
Isometric illustration of a skid-mounted treatment unit: electrochemical reactor, phase separation vessel and filtration columns connected.
Conceptual illustration of a skid unit — the actual layout comes from characterization and testing.

Process

From the first sample to monitored operation.

A project flow in five steps, from effluent characterization to routine operation. Each step decides the next: nothing is sized before measuring, and nothing is deployed before testing.

  1. Characterization

    The client's stream is sampled and characterized: organic matter, oils and greases, salts, solids, pH. Characterization answers the opening question — what water is this, and what makes it hard.

  2. Treatability test

    Bench tests and, when necessary, pilot tests try routes that combine the reactor with process auxiliaries. Analyses at an accredited laboratory measure what each route delivers on that matrix.

  3. Sizing

    With the route validated, the skid unit is sized: modules, reactor time, auxiliaries and polishing. Sizing comes from the test numbers — not from a catalog table.

  4. Deployment

    The unit arrives assembled on its skid and is integrated into the existing operation. Modules add up as volume grows, and deployment respects the plant's routine — not the other way around.

  5. Monitored operation

    Remote operation, automation and telemetry follow the unit in regime. Performance is the one agreed from characterization; monitoring is continuous, with logged parameters.

Every stream starts with characterization — from it come the route, the sizing and the agreed performance. If the tests show the matrix does not support the desired destination, we say so before deploying.

Field record

Installation and process images from our operating base, with no identification of clients, units or locations. A documentary record: how the equipment presents itself and operates day to day.

Vessel and piping detail.
Phase separation in a tank.
Samples side by side — conceptual reference.
Analysis and control bench.
Filtration and polishing skid.
Detail of a process vessel connected to piping.

Briefing

Build your technical briefing.

Answer the essentials — sector, origin, volume and goal. The summary is generated here, in your browser, as plain text ready to paste into an email: nothing is sent, nothing is stored outside your device.

Sector
Stream origin
Volume range
Goal
Known analytics

Your summary stays in this browser only.

Briefing summary

TECHNICAL BRIEFING — CWS
Sector: Not informed
Stream origin: Not informed
Volume range: Not informed
Goal: Not informed
Known analytics: Not informed
Notes: Not informed

FAQ

What we are asked before starting.

Do you sell the equipment?

No. The model is a service: what is contracted is the treatment of the stream, and the skid unit is ours. The client buys no asset, operates no unit and carries no responsibility for keeping the process tuned.

What do we need to send to get started?

A representative sample of the stream and the context of the operation: origin, volume, desired destination and local constraints. Recent analytics help; if there are none, the initial characterization fills the gap.

Is the treatment free of chemicals?

We do not claim that. Real routes combine the reactor with process auxiliaries — polymers, pH adjustment, peroxide, filtration or flotation — defined test by test. What electrochemistry does is generate the main treatment agents in situ, reducing dependence on external dosing.

How long does a treatability test take?

It depends on the matrix and on sample availability: characterization, bench tests and analyses at an accredited laboratory each have their own timelines. We do not promise a fixed schedule without knowing the stream; the timeline is agreed after characterization.

Does reinjection work for any well?

No. Reinjection is conditioned on chemical compatibility between the treated water and the well: incompatible mixtures can form precipitates and compromise the formation. The assessment starts with the chemistry of the water and the formation, before any injection decision.

Does recovered oil come with the proposal?

As a route under development. The sequence — emulsion breaking, flotation, centrifugation — is separate from the water stream and remains under evaluation. When mature, it returns oil to the producer; until then, we do not present it as a consolidated route.

How do you scale from bench to skid?

Through the same route, validated in stages: bench, pilot when necessary, and only then sizing of the unit. Nominal 10 m³/h modules add up as volume grows, and operating parameters come from the tests — not from extrapolation.

What does this site not guarantee?

No result numbers. Removal values hold for the sample and the route tested; each new stream requires its own characterization and testing. What we agree on is a process: measure first, size later, operate with follow-up.

About

A project in the making, for complex waters.

CWS — Complex Water Solutions — is a project in the making, dedicated to complex waters — oily, saline, of variable load. We start from an electrochemical technology with an operating history and organize it as a service: characterization, treatability testing, skid sizing, deployment and monitored operation, case by case. The model grew from a simple observation: most operations do not want to run a treatment plant — they want the stream resolved.

We speak the technical language and avoid promises. What counts is what the tests show for your stream, measured at an accredited laboratory and discussed with the numbers on the table. Where the route needs auxiliaries, we say so; where the destination is conditioned — on the matrix, on the permit, on compatibility with the well — we write the condition alongside. That is how we believe trust is built: with explicit conditions, not superlatives.